

Market Update
July 2026 Outlook & Positioning.
Here is our latest Market Update.
As always, if you’d like to discuss this—or anything regarding current market conditions or your portfolio—please feel free to contact us at any time.
Presented by Andrew Harris, Michael Kolb, CFP®, James Dinsmore, CFP®, Ed Barone, Todd Rishel, CFP® & Martin Wildy, CFA
Executive Summary
- Equity markets stalled somewhat in June but still produced positive returns through the
second quarter and first half of 2026 (see chart below). - While the conflict in Iran is not fully resolved as of this writing on July 3rd, 2026, its cooling
led oil prices to fall back to near pre-conflict levels, potentially providing some respite for
consumers struggling with higher prices. - SpaceX went public last month as the first of the highly anticipated mega-cap IPOs,
potentially setting the stage for OpenAI and Anthropic to test markets in the second half of
the year. - The Federal Reserve met in June with Chair Kevin Warsh at the helm for the first time, and
while they kept interest rates unchanged, Warsh struck a hawkish tone suggesting inflation is
still running too high for comfort.
Equity Markets Up YTD, But Stall in June
The astronomical rise of a handful of technology stocks, many of them related to memory and
storage for artificial intelligence (AI), has helped to lift both US and emerging markets indexes so
far in 2026. Companies such as Micron, Advanced Micro Devices, Dell, Sandisk, and IBM, as well
as South Korean companies SK Hynix and Samsung, appear to have taken over the leadership role
from the “Magnificent 7” this spring. [1]
However, the rally lost steam in June as questions about inflation, market leverage, and the
sustainability of the AI trade soured sentiment somewhat.[2] Despite the S&P 500 and the more
technology-heavy Nasdaq index falling slightly for the month, the two indexes ended June with their
best quarterly return in six years.[3] Emerging markets and small-cap stocks (as represented by the
MSCI Emerging Markets and Russell 2000 indexes, respectively) fared even better in the first half of
2026, with each advancing more than 20% as the two continue to lead equity asset classes (see
below).

Markets Remain Optimistic on Conflict Resolution
Negotiations toward a durable peace agreement with Iran remain ongoing under the 60-day
framework established by the memorandum of understanding. Although violence has continued
intermittently, markets remain optimistic that the conflict will be resolved. That optimism was
supported by a tentative ceasefire agreement announced on June 28 that is intended to pause
hostilities and allow peace talks to resume.[4]
Despite the difficulties in negotiations, energy markets appear confident that an agreement will be
reached in the near future as prices have fallen back toward pre-conflict levels. Oil prices are now
just above where they were when the conflict broke out, while gas, diesel, and jet fuel all remain at
least 20% higher (see charts below).[5] If traffic through the Strait of Hormuz begins to normalize
soon, we anticipate inflation beginning to recede from its current level (inflation currently sits at
4.2% year-over-year, more than double the Federal Reserve’s 2% target).[6] However, if the closure
persists, we expect inflation to remain higher for longer, putting additional strain on consumers (and
pressure on the Fed to raise interest rates to dampen inflation).

Changing of the Guard at the Fed
Last month also marked the first Federal Reserve (Fed) meeting with Kevin Warsh as Chair, as he
took over leadership after Jerome Powell’s tenure came to a close (although Powell remains a voting
member). As promised, Warsh provided less from a communication and forward guidance
perspective (the official Fed statement was approximately 130 words, down from about 340 words
in Powell’s final statement in April), instead committing to the creation of five task forces to review
the role of monetary policy at the Fed.[7] Recommendations from the task forces are expected by
year-end, but we expect some reduction in the size of the Fed’s balance sheet given Warsh’s
previous comments.[8]
The Fed unanimously voted to hold rates steady in June, marking the first unanimous vote since
June of 2025. However, for those anticipating Warsh to be more dovish on inflation, he quickly
dispelled those expectations. He called out the current energy shock created by the Iran conflict as a
reason for concern and ended his statement abruptly with the pledge, “The Committee will deliver
price stability.”[9] Markets reacted as expected to the hawkish tone of the meeting, as equity market
retreated somewhat immediately afterward.[10]
The 10-year Treasury yield closed June at approximately 4.45%, below its peak in May but still
higher than where it stood at the beginning of the year. The 2-year Treasury yield ended the month
slightly higher at 4.15%. That marks a significant jump from the beginning of the year before the Iran
conflict broke out when markets were pricing in interest rate cuts rather than rate hikes for 2026.[11]
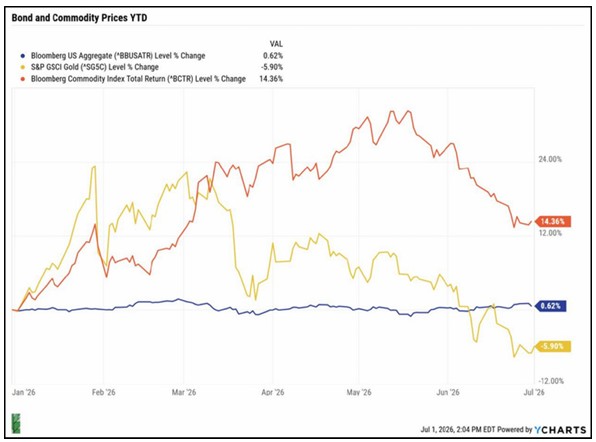
Bonds, as represented by the Bloomberg US Aggregate index, are modestly positive year-to-date.
Broad-based commodities (Bloomberg Commodities index) rallied through the first part of the year
as energy prices climbed during the Iran conflict but have fallen as the worst of the violence appears
to have subsided. Gold (S&P GSCI Gold index) also rose in the spring but has fallen since as the metal
continues to search for a market narrative.
Market Concentration & Leverage Create Volatility Concerns
As we have discussed in previous Dashboards, market concentration in the largest US corporations
has been growing over the past few years as several AI-related technology companies continue to
lead the domestic markets higher. Leadership has shifted somewhat this year away from the
Magnificent 7 toward the semiconductor and memory companies mentioned previously (see below
left).[12] However, the top 10 companies in the S&P 500 index now represent approximately 40% of
the index’s market cap and 35% of 12-month forward earnings (see below right).[13]

This market concentration phenomenon has also spread to emerging markets as Samsung Group
and SK Hynix have joined Taiwan Semiconductor Manufacturing as the largest holdings in the MSCI
Emerging Markets index (the three currently represent about 31% of the iShares MSCI EM ETF,
ticker EEM, as of June 30).[14]
Samsung Group and SK Hynix have rallied significantly this year as the two companies announced
plans to expand production capacity by spending over $800 billion to build additional semiconductor
plants in South Korea. President Lee Jae Myung went so far as to refer to the companies as “national
heroes,” as the country seeks to double its memory production capacity in the next five years.[15]
It is important to note that market concentration is not new; it is something we have been tracking
and writing about for years. However, the rising level of leverage that accompanies this market
concentration is a recent development. For example, assets in leveraged US ETFs (see bottom left)
and margin loans outstanding in South Korea markets (bottom right) are both growing alongside
increased market concentration in those two markets.[16] &[ 17]

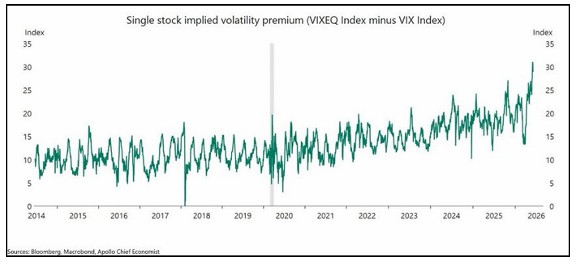
Our concern is that these two phenomena – rising market concentration and increased leverage –
occurring in tandem have the potential to markedly amplify market volatility. We are seeing some of
that in the broad market, but it is more pronounced in single-stock implied volatility. As illustrated
below, single-stock implied volatility premium for the S&P 500 index is now well above any level
we’ve seen going back to 2014.[18]
The Path Forward
The first half of 2026 ended with relatively strong returns given that the Iran conflict effectively
closed the Strait of Hormuz for several months, through which approximately 20% of global energy
flows. Many of the major equity markets advanced 10% or more despite the volatility, and small-cap
US and emerging markets stocks performed even better.
Additionally, June witnessed the initial public offering of SpaceX. By most accounts, the IPO was a
success as the stock ended June about 26% above its IPO price.[19] The launch potentially sets the
stage for other highly anticipated IPOs, such as OpenAI and Anthropic, in late 2026 or early 2027.
The US economy also proved resilient in the first half of the year. Despite concerns that AI would
threaten jobs, unemployment remains at just 4.2%. Economic growth remains positive, as year-overyear
gross domestic product sits at a respectable 2.7% based upon the most recent reading.[20]
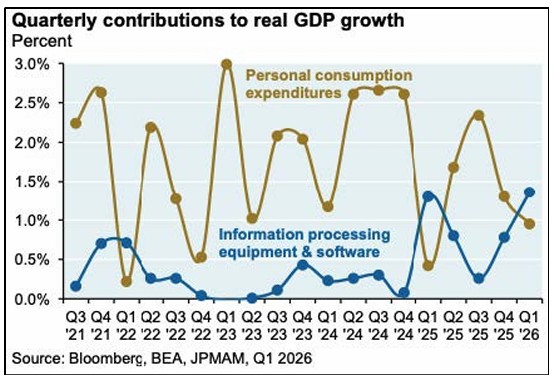
However, the AI story remains a major influence on the US economy as well, underpinning growth
through difficult stretches. For example, the quarterly contribution to economic growth related to
the data center buildout exceeded the contribution of all personal consumption expenditures in the
first quarter of 2026 (see below).[21]
In some ways, AI has been a blessing over the past few years for both markets and the economy.
However, as market concentration and leverage continue to build, we feel as though both the
market and economy increasingly hinge on one assumption – that advancements in AI will increase
productivity and wealth without displacing workers. This outcome is entirely possible, and we hope
it proves true, but we caution investors against concentrating their wealth in a single thesis,
however compelling.
As always, we appreciate your continued trust and welcome the opportunity to speak with you in
greater detail regarding your specific situation.
Sources & References
[1] Source: YCharts, June 30, 2026, and Financial Times, “Magnificent Seven stocks shed $2.3tn in Wall Street tech rotation,” June 30,
2026. https://www.ft.com/content/b90bdfcb-d773-42f7-bb5f-52dbd28b2174?syn-25a6b1a6=1
[2] Source: Financial Times, “S&P 500 notches longest losing streak in 10 months as chipmakers slide,” June 26, 2026.
https://www.ft.com/content/bb70e272-5b09-4806-8b19-7c03c350f580?syn-25a6b1a6=1
[3] Source: YCharts/MT Newswires, “Update: Dow Hits Fresh High as Wall Street Posts Solid Quarterly Gains,” June 30, 2026.
https://www.marketscreener.com/news/dow-hits-fresh-high-as-wall-street-posts-solid-quarterly-gains-ce7f5fddd88ef62d
[4] Source: Wall Street Journal, “U.S. and Iran Agree to Halt Days of Fighting Over Strait,” June 29, 2026.
https://www.wsj.com/world/middle-east/iran-asserts-sole-control-of-hormuz-warns-challenges-will-bring-more-violence-5abea3c7?
mod=hp_lead_pos1
[5] Source: JP Morgan, “Eye on the Market,” June 2026. https://am.jpmorgan.com/content/dam/jpm-amaem/
global/en/insights/eye-on-the-market/trump-tracker-amv.pdf
[6] Source: YCharts, June 30, 2026
[7] Source: FHN Financial, “Economic Weekly,” June 26, 2026. https://docs.fhnfinancial.com/?ab2bd8d9-efb3-48a4-975c-
78377fa01e12
[8] Source: Federal Reserve, “Transcript of Chairman Warsh’s Press Conference,” June 17, 2026.
https://www.federalreserve.gov/mediacenter/files/FOMCpresconf20260617.pdf
[9] Source: FHN Financial, “Economic Weekly,” June 18, 2026. https://docs.fhnfinancial.com/?33c2c960-8d46-4907-857bea4251c70033
[10] Source: YCharts, June 30, 2026.
[11] Source for all yield data: YCharts, June 30, 2026.
[12] Source: Financial Times, “Magnificent Seven stocks shed $2.3tn in Wall Street tech rotation,” June 30, 2026.
https://www.ft.com/content/b90bdfcb-d773-42f7-bb5f-52dbd28b2174?syn-25a6b1a6=1
[13] Source: JP Morgan, “Eye on the Market – Semiquincententacles,” June 2026. https://am.jpmorgan.com/content/dam/jpm-amaem/ global/en/insights/eye-on-the market/semiquincententacles-amv.pdf email_campaign=314411&email_job=658351&email_contact=003j0000018XrBPAA0&utm_source=clients&utm_medium=email&utm
_campaign=ima-eotm-inst-06232026&memid=7220927&email_id=100167&decryptFlag=No&e=ZZ&t=603&f=&utm_content=readeotm
[14] Source: YCharts, June 30, 2026.
[15]Source: Bloomberg, “Samsung, SL to Spend $880 Billion to Drive Korea’s AI Lead,” June 28, 2026.
https://www.bloomberg.com/news/articles/2026-06-28/samsung-sk-reportedly-to-invest-1-3-trillion-over-10-years?
cmpid=062926_marketsdaily&utm_campaign=marketsdaily&utm_medium=email&utm_source=newsletter&utm_term=260629&utm_
content=6021
[16 Source: Source: JP Morgan, “Eye on the Market – Semiquincententacles,” June 2026.
https://am.jpmorgan.com/content/dam/jpm-am-aem/global/en/insights/eye-on-the-market/semiquincententacles-amv.pdf?
email_campaign=314411&email_job=658351&email_contact=003j0000018XrBPAA0&utm_source=clients&utm_medium=email&utm
_campaign=ima-eotm-inst-06232026&memid=7220927&email_id=100167&decryptFlag=No&e=ZZ&t=603&f=&utm_content=readeotm
[17] Source: Wall Street Journal, “The Trillion Dollar Borrowing Binge Lifting the Stock Market to Risky Heights,” June 28,2026.
https://www.wsj.com/finance/stocks/the-trillion-dollar-borrowing-binge-lifting-the-stock-market-to-risky-heights-8d0377f9?
mod=hp_lead_pos2
[18] Source: Apollo, “Daily Spark – Tech Dominance Is Pushing Single Stock Risk to Records,” June, 10, 2026.
https://www.apollo.com/wealth/insights-news/insights/daily-spark/tech-dominance-is-pushing-single-stock-risk-to-records?
utm_medium=email&utm_source=pardot&utm_id=1feca30be61a1077771319ee7e2f5367&utm_campaign=EXT_Daily+Spark&utm_c
ontent=body-image-dailyspark-chart1
[19] Source: YCharts, June 30, 2026.
[20] Source: YCharts, June 30, 2026.
[21] Source: JP Morgan, “Eye on the Market – Semiquincententacles,” June 2026. https://am.jpmorgan.com/content/dam/jpm-amaem/
global/en/insights/eye-on-the-market/semiquincententacles-amv.pdf?
email_campaign=314411&email_job=658351&email_contact=003j0000018XrBPAA0&utm_source=clients&utm_medium=email&utm
_campaign=ima-eotm-inst-06232026&memid=7220927&email_id=100167&decryptFlag=No&e=ZZ&t=603&f=&utm_content=readeotm
Important Information
All investments contain risk and may lose value. Past performance is not an indication of future performance. Information contained herein has been obtained from sources believed to be reliable but not guaranteed. This material has been distributed for informational purposes only and should not be considered as investment advice or a recommendation of any particular security, strategy or investment product.
Statements concerning financial market trends or portfolio strategies are based on current market conditions, which will fluctuate. There is no guarantee that these investment strategies will work under all market conditions or are appropriate for all clients and each client should evaluate their ability to invest for the long term, especially during periods of downturn in the market. Outlook and strategies are subject to change without notice.
Content is provided by Investment Research Partners, LLC (IRP). IRP employs multiple artificial intelligence platforms for the purpose of researching topics, assisting with reviewing investments, and comparing various investment platforms. IRP has evaluated the security of these AI platforms and does not use any platform that uses client information to train its models or that maintains sensitive client information in its records. Further, human input is required by IRP policy to ensure accuracy of the information generated by AI, and any data aggregation or document summaries. The use of these platforms will be reviewed periodically to ensure confidentiality and accuracy as well as efficiency.
Certain third-party sources cited in this material may require a paid subscription or may otherwise be located behind a paywall. If you would like more information regarding any cited source, please contact IRP and we will provide additional details upon request.
Resources for You

Webinars
Expand your financial literacy with valuable webinars developed by our experts. Learn about asset management, financial planning, and more.

Videos
Watch our videos to help get you started on your journey toward financial freedom. Learn actionable tips for responsible investing and insurance.

Calculators
Use our calculators to make informed decisions about your investments, retirement savings, automotive loans, mortgage, and personal finances.
